The U.S. housing market has been on a tirade since the pandemic, and the market in the few past was defined by high mortgage rates, peak property values, and inventory lagging behind demand. According to data from J.P. Morgan, Statista, Zillow, and other authoritative sources, the 2026 real estate market is expected to stabilize. We pulled together our own expert insights and real estate market data to forecast where the market is headed in 2026, including home prices, inventory levels, and more.
Key takeaways:
The U.S. residential real estate market is projected to reach $127.4 trillion by 2029.
Home prices decreased in 17 states; Florida, D.C., and Arizona saw the largest dips (over 2%).
Wisconsin, North Dakota, and Illinois lead the country with one-year price jumps exceeding 4%.
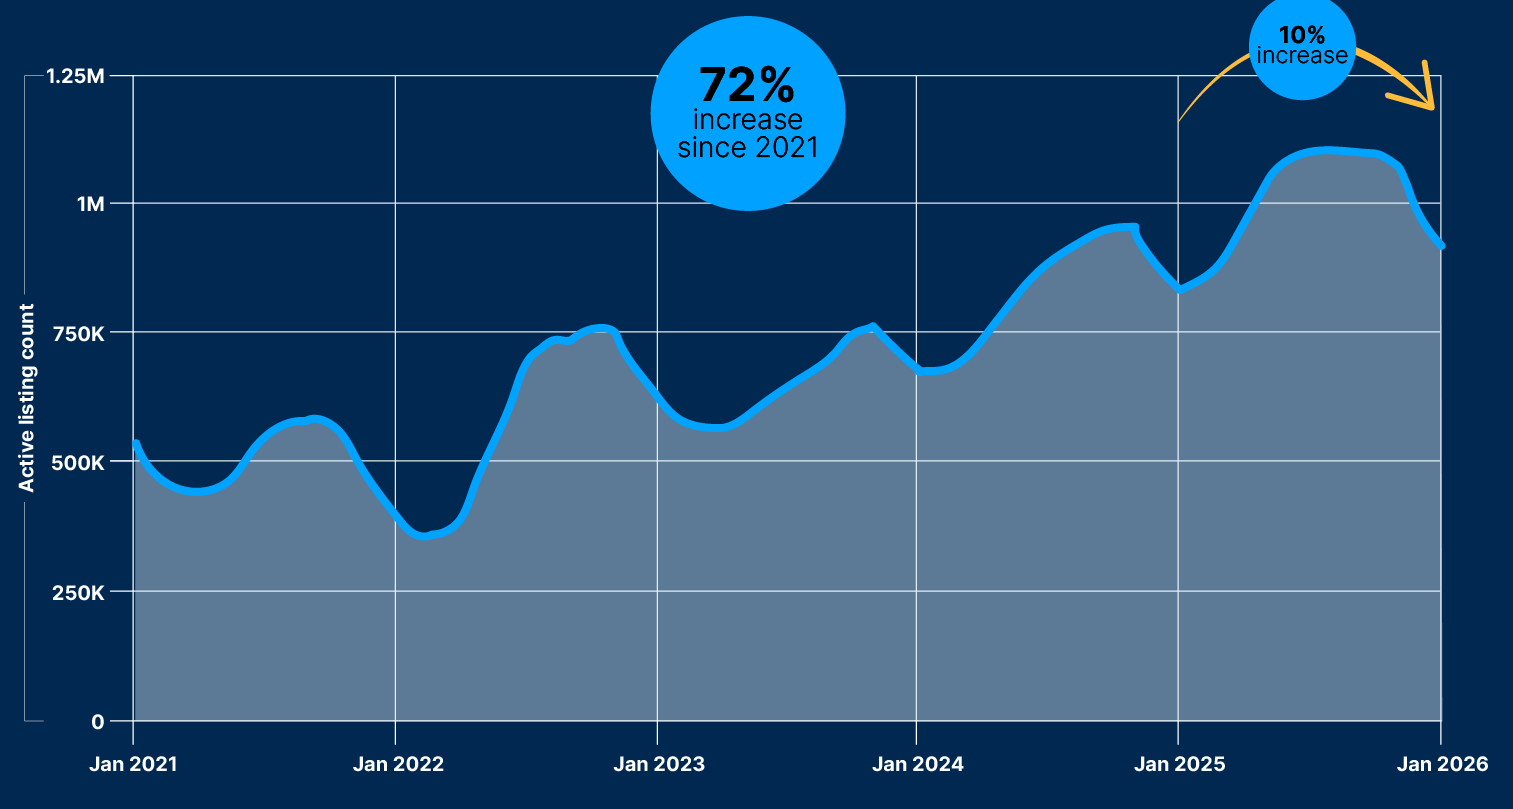
Housing inventory has grown 10% over the past year and is up a staggering 71.63% compared to five years ago.
Rochester, NY, remains the strongest seller’s market, while Albany, GA, is the top buyer’s market.
Industry experts forecast a stabilization of the housing market in 2026.
Residential Real Estate Market Value
Residential real estate market value has been steadily increasing since 2019, with every year bringing higher value than the last except 2023. Value dipped in late 2022 and 2023 as homebuyers rushed to stay ahead of climbing mortgage rates¹, but they quickly climbed again in 2024 to historical highs. Housing market data suggest that value will continue to rise in 2026 to new highs, and that trend is expected to persist through 2029 despite a decline in affordability.
 From 2019 to 2024, the residential real estate market grew by 48.8%. It’s projected to reach 127.4 trillion by 2029, according to Statista². The upward movement of the market could end up being more significant if mortgage prices come back down, as analysts have been predicting for some time now.
Keep in mind that these are national numbers, and value swings will vary widely across individual markets.
Home Prices and Sales
All markets are driven by supply and demand, so there’s much insight to be gained from looking at home prices and inventory fluctuations.
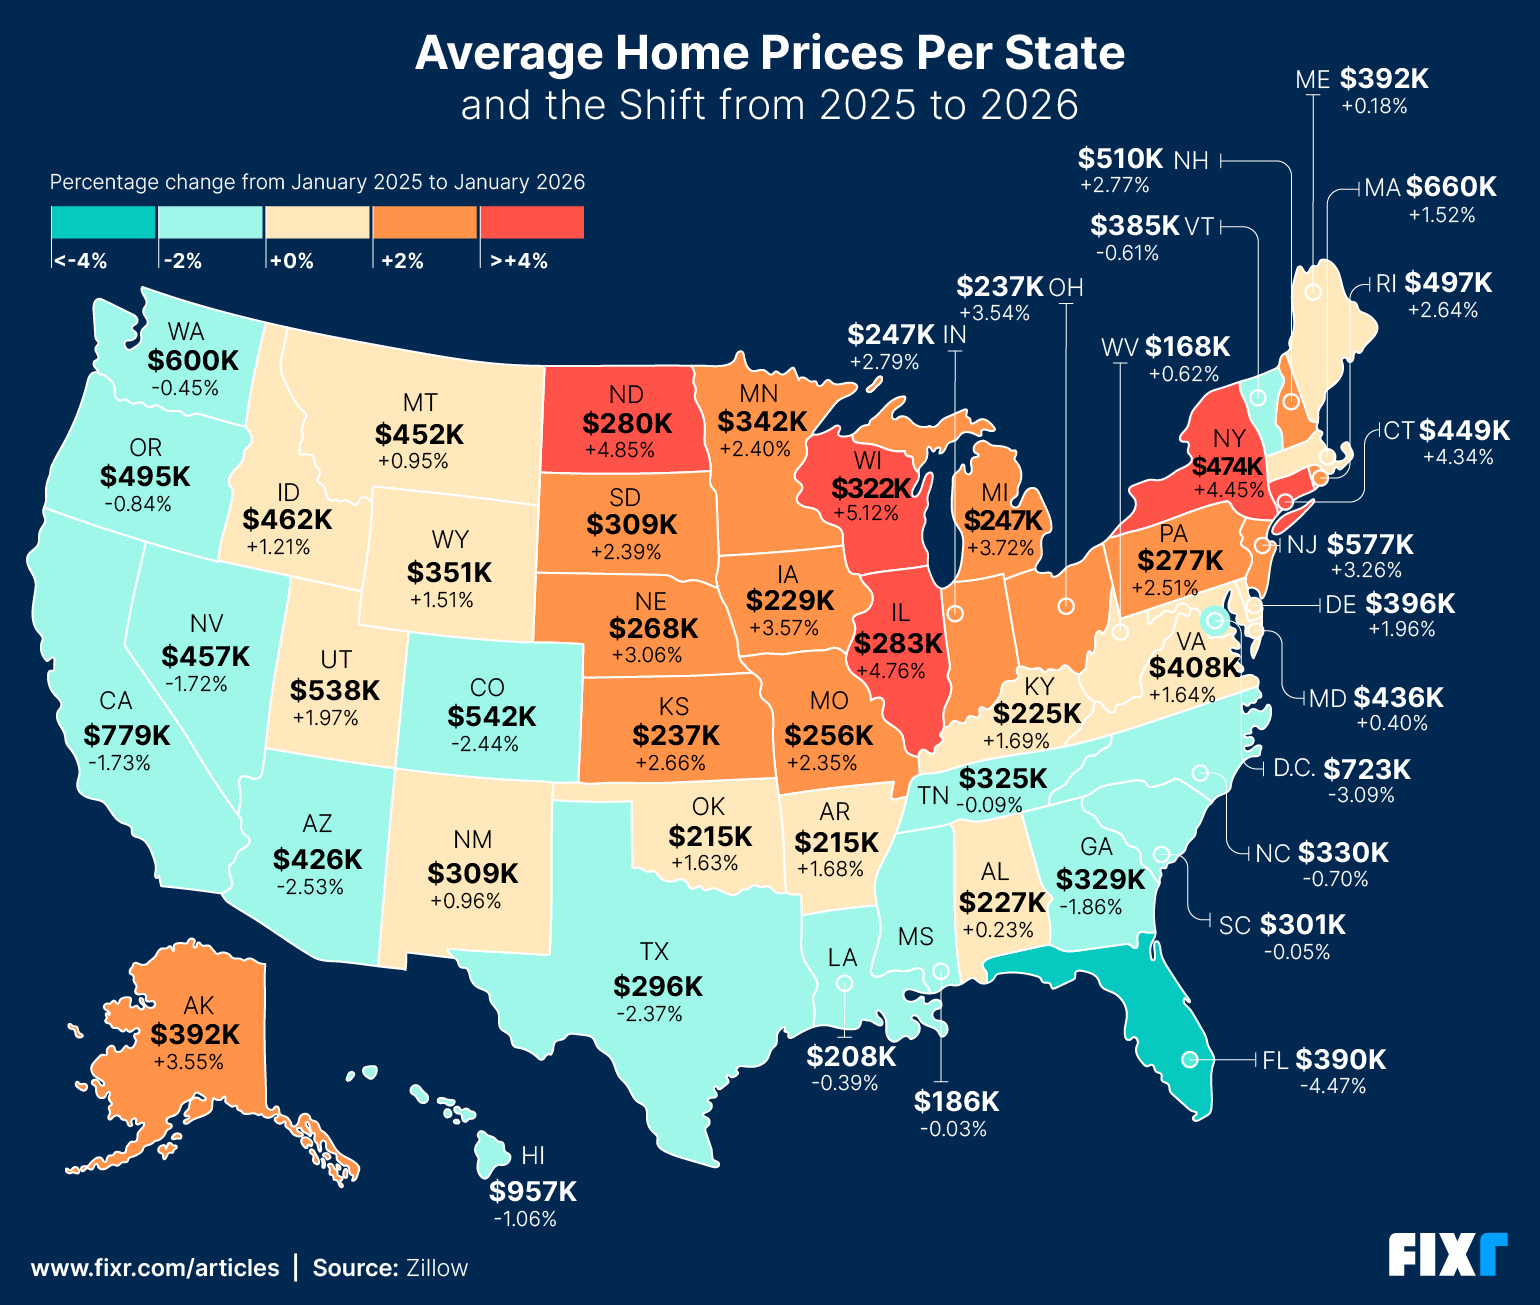 The market remains a tug-of-war between supply and demand. According to Zillow³, the national average home value in early 2026 is $357,445, a modest 0.2% increase from last year. Of course, the average price varies by state. The highest values in the country are in Hawaii, with an average sale price of $956,542. The lowest values are in West Virginia, with an average sale price of just $168,181.⁴
In 2026, home prices decreased in 17 states, with the largest falls over 2% seen in Florida (-4.47%), District of Columbia (-3.09%), Arizona (-2.53%), Colorado (-2.44%), and Texas (-2.37%).⁴ However, Wisconsin, North Dakota, Illinois, New York, Connecticut, and Michigan experienced the biggest hikes of over 4% year-over-year.
Sale Inventory Levels
Inventory and existing home sales are at near-20-year lows, so buyers are still seeing loads of competition for the minimal inventory that is available. According to Realtor, homes in the U.S. are listed for 78 days³ before they get an accepted offer. For comparison, that’s 27 days above the 5-year average of 51 days⁵. With homes moving to “under contract” so quickly, it’s no surprise that national housing availability is still sitting well below where it was pre-pandemic.
 Housing inventory is a major driver of home values. As inventory declines, there are more buyers to compete for each property, and that increased demand causes prices to rise as buyers try to beat each other out for homes.
Since January 2021, we saw the lowest inventory in February 2022, when the available inventory was 163.39% lower compared to the beginning of 2026. The supply has rebounded since then, and the active listing count is 10.05% higher than it was a year ago and 71.63% higher than it was 5 years ago. Year-on-year inventory increase by region looks like this:⁶
West: +12.2%
Midwest: +10.3%
South: +10.1%
Northeast: +6.6%
In July 2025, housing inventory reached its highest level in recent years. That’s a 24.76% increase from July 2024.
It’s always challenging to parse these kinds of statistics, but these numbers all point to the market finally turning around.
Buyers vs. Sellers Markets Across the U.S.
Knowing whether it’s a buyer’s or seller’s market is helpful for getting rough estimations of property availability and prices in the near future because the distinction reflects how supply and demand are interplaying.
In a buyer’s market, there’s more inventory than there are buyers, meaning buyers have their pick of multiple properties. This represents lower competition, and homes tend to sit on the market for longer. Usually, this causes sellers to drop prices to entice buyers to choose their homes.
In a seller’s market, the number of active buyers outpaces the inventory, which means there’s more competition for each home. More competition means buyers need to offer more money to secure housing, which drives up the cost of homes.
Housing market conditions vary across metro areas. Some remain seller’s markets with high demand and rising prices, while others have shifted to buyer’s markets with longer time on the market and slowing price growth. Many areas fall somewhere in between, maintaining a more balanced, neutral market. Having a general idea of where a specific market currently stands is always helpful for making informed decisions about relocating.
The following table highlights the metro areas experiencing the most significant imbalances in supply and demand, categorizing the locations where either sellers or buyers currently hold a strong negotiating advantage.⁷
Strong Seller's Markets | Strong Buyer's Markets |
|---|---|
1. Rochester, NY | 1. Albany, GA |
2. San Jose-Sunnyvale, CA | 2. Valdosta, GA |
3. San Francisco, CA | 3. Cincinnati, OH-KY-IN |
4. Hartford, CT | 4. Dothan, AL |
5. Syracuse, NY | 5. Terre Haute, IN |
6. Manchester-Nashua, NH | 6. Florence, SC |
7. Bridgeport-Stamford-Norwalk, CT | 7. Macon-Bibb County, GA |
8. Albany-Schenectady-Troy, NY | 8. Jackson, TN |
9. Racine, WI | 9. Gulfport-Biloxi, MS |
10. Buffalo-Cheektowaga, NY | 10. Bloomington, IN |
11. Ann Arbor, MI | 11. Bangor, ME |
12. Boston-Cambridge-Newton, MA-NH | 12. Evansville, IN-KY |
13. Anchorage, AK | 13. Saginaw, MI |
14. New York-Newark-Jersey City, NY-NJ-PA | 14. Longview, TX |
15. Minneapolis-St. Paul-Bloomington, MN-WI | 15. Rocky Mount, NC |
16. Madison, WI | 16. Beaumont-Port Arthur, TX |
17. Lancaster, PA | 17. Elizabethtown-Fort Knox, KY |
18. Santa Rosa-Petaluma, CA |
Expert Insights on Real Estate Trends for 2026

To gain a deeper understanding of the shifting landscape, we consulted with industry experts to identify the key factors shaping the 2026 housing market. From shifting migration patterns to the evolution of home design, here is what the pros expect for the year ahead.
Expert contributors:
Ben Harris, Real Estate Advisor, Sotheby's International Realty
Jeff Lichtenstein, CEO and Broker, Echo Fine Properties
Matt Brown, Real Estate Agent and Broker Associate, William Raveis
Nikki Bernstein, Associate Broker, Engel & Völkers Scottsdale
Olivia Barrett, Realtor, Guide Real Estate in California
Homebuyer Migration Trends
Lifestyle over location
Buyers are no longer just looking for a zip code; they are looking for a specific way of life. “While close commutes are still valued, lifestyle and space needs (home offices, fitness rooms) are driving demand, causing some to move to more affordable, smaller cities or suburbs,” says Brown.
This is confirmed by Harris, who notes that “buyers are more selective and focused on homes that offer real lifestyle value.” Harris adds, “We’re seeing strong interest in homes located in gated communities or properties that offer a sense of seclusion.”
Hyperlocal climate migration
Environmental factors and the rising cost of homeownership in vulnerable areas are beginning to redraw the map at a local level. According to Brown, “Insurance costs are forcing buyers in high-risk zones (e.g., parts of Florida, California) to move to safer, neighboring areas within the same metro.”
Housing Preferences
High costs and demographic shifts are changing the types of homes in demand. Multigenerational living is no longer a niche market, it is a significant driver of sales.
“Due to high costs, households are consolidating. Multigenerational purchases are at record highs (17% of sales). Buyers are seeking homes with in-law suites or garages convertible to extra living spaces,” Brown explains.
Barrett highlights a specific architectural shift: “We have seen a trend toward single-story homes or homes with a downstairs guest suite. This is primarily due to aging parents and the rising costs of care facilities. Single-story homes have seen increased interest for the same reason, as well as downsizing needs and mobility issues.”
Home Design Trends
The "fixer-upper" era is cooling as buyers prioritize convenience and wellness. Today’s buyers want a home that functions as a sanctuary from the moment they get the keys.
“Buyers want homes that feel finished on day one, ‘move-in ready.’ The imagination they once had for renovation has waned,” says Bernstein. To sell faster in this environment, experts recommend high-quality finishes, increased kitchen storage, and warm neutral colors for both the interior and exterior.
Furthermore, luxury is being redefined through the lens of health. Harris observes, “One of the biggest emerging trends we’re seeing, particularly in the luxury segment, is a strong focus on wellness within the home. Buyers are increasingly looking for spaces that support their overall well-being, whether that’s spa-like bathrooms, areas for relaxation and recovery or even dedicated wellness rooms and cold plunge features. Wellness used to be considered an extra amenity, but now it’s becoming a priority as buyers increasingly want their homes to provide a complete lifestyle experience.”
Real Estate Market Predictions

Will home prices drop in 2026?
The consensus among experts is one of stabilization rather than a crash. Brown notes, “Nominal home prices are not expected to continue declining on a national level. Instead, they are expected to grow modestly, roughly 1% to 2% in 2026, effectively flattening out after the rapid gains of the pandemic era.” Brown also points out that “While inventory is increasing, it remains below pre-pandemic levels in many areas, preventing a supply glut.”
However, Brown warns that “While sticker prices may slightly rise, they will likely fall in 'real' (inflation-adjusted) terms, as overall inflation (3%+) may outpace nominal home price growth (2%+).”
Harris notes: “While there have been some minor price adjustments compared to 2025, I do not expect a major downward trend moving toward 2027. From February onward, there have been noticeably more homes going under contract across a range of price points.”
Bernstein agrees and adds, “When budgets tighten, pricing naturally adjusts to meet the market. However, I do not expect dramatic declines that fundamentally change the character of our neighborhoods.” Barrett thinks that “It will be interesting to see the data as it unfolds and see if market continues to improve. Considering we are headed into our busy season, we have the potential of that momentum but unease in the market is still looming.”
Will interest rates drop in 2026?
Expectations for a return to ultra-low rates remain low. Economists don't anticipate a dip into the 3% or 4% range in the foreseeable future.⁸
Brown also predicts that “Rates are expected to slowly drift down, averaging in the 6.0%–6.3% range, but they are unlikely to fall below 6% for any sustained period.”
However, some experts suggest that the "plateau" at 6% may not be low enough to fully revitalize the market. Lichtenstein thinks that the psychological barrier for buyers has shifted: “Rates have been hovering at around 6%, which is far better than the 7% or 8% we were seeing a year or two ago. But with inflation, 5% or 5.5% might have to become the new 6% in order to get the market moving.”
First-time homebuyer challenges
The path to homeownership remains difficult for those entering the market. “While affordability is improving, first-time buyers are facing an older, more established market. Many are relying on family, taking money out of retirement accounts, or using equity to make purchases,” says Brown.
Conclusion: A Year of Stabilization
The 2026 real estate market is defined by a transition toward a "new normal," marking the end of the post-pandemic volatility. As the rapid price fluctuations of previous years subside, the market is entering a period of steadying inventory and more predictable growth. While high borrowing costs continue to influence purchasing power, the current environment suggests a healthy rebalancing between supply and demand. J.P. Morgan Global Research sees U.S. house prices stalling at 0% in 2026.⁸ Rather than a dramatic shift in either direction, 2026 is emerging as a year of recalibration, where pricing stabilizes and the market finds a more sustainable and balanced pace for both buyers and sellers.
Methodology
To analyze the residential real estate market, we took data on estimated market values and projected values between 2019 and 2029 from Statista². We then calculated the percentage changes over the past 5 years and determined the predicted percentage change moving forward.
To determine home prices by state, we compared sale data from Zillow³ from 2025 through January 2026 and calculated the percent change year-over-year.
For the sales inventory levels, we used data from FRED⁵ and compared one-year and five-year changes in available inventory.
Irena is an industry analyst and content specialist at Fixr.com, where she transforms complex data into clear insights that help readers make smarter financial decisions. She holds a degree in Economics and has been conducting personal finance research since 2018, bringing a strong analytical foundation to her work. Her insights have been featured in reputable outlets such as the Washington Examiner, Yahoo Finance, Fox40, and Forbes.
Real Estate Market Trends FAQ
Not exactly. While price growth is slowing and some "real" (inflation-adjusted) values may dip, nominal prices are expected to remain stable or see modest gains of 1-2% due to low inventory.
The 7% rule is a guideline suggesting that if the cost of selling and buying a new home (closing costs, commissions, etc.) exceeds 7% of the home's value, it may not be financially beneficial to move unless you plan to stay long-term.
Key trends include a rise in multigenerational living, a preference for move-in-ready homes, and lifestyle-driven relocation or climate-driven relocation to "safer" local areas.